Executive summary
- How do citizen-science orgC estimates compare with laboratory results?
- How does the direct grey-corrected SOC formula perform as a non-trained baseline?
- Which grey-scale image model is selected by repeated cross-validation, and how does it perform on the untouched final test set?
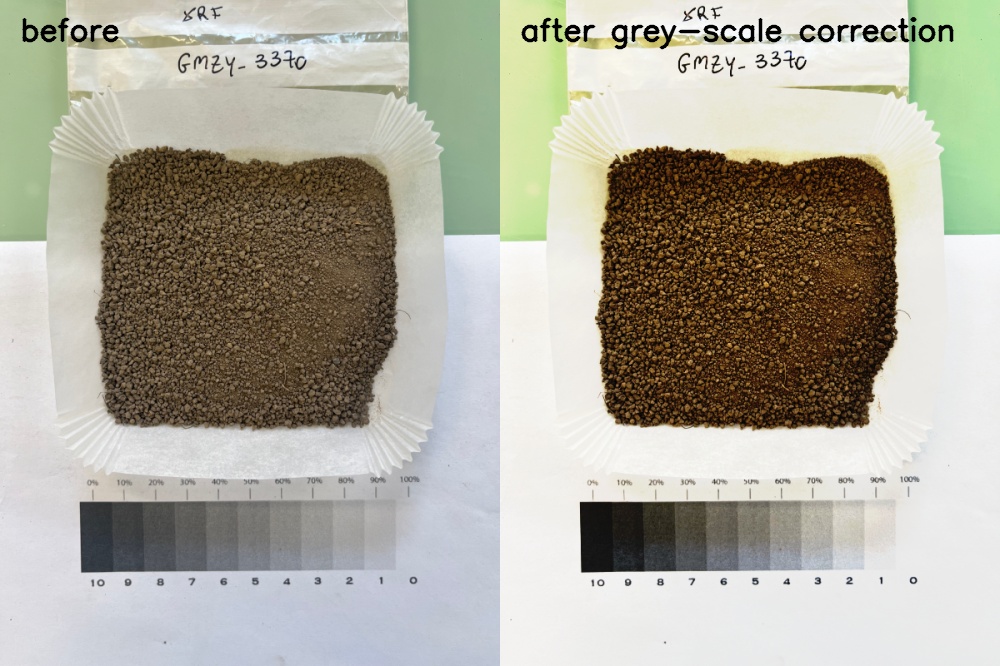
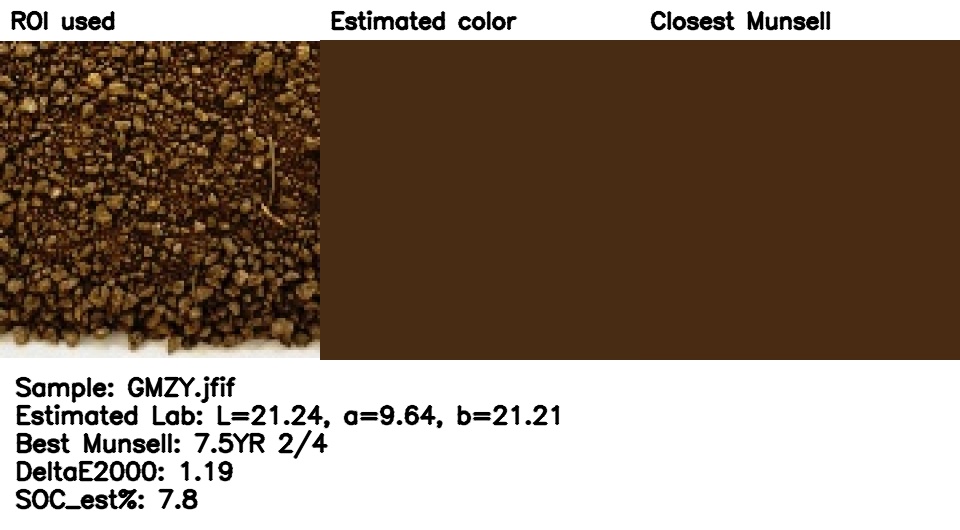
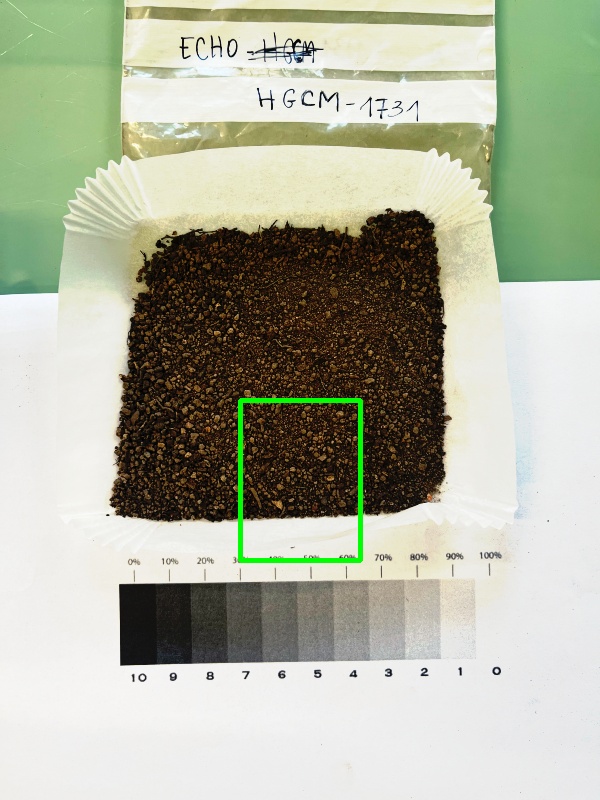
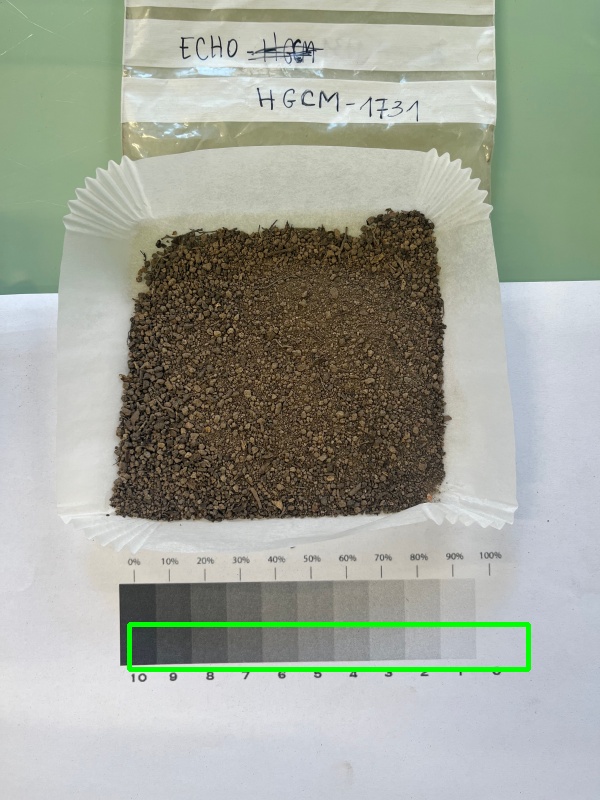
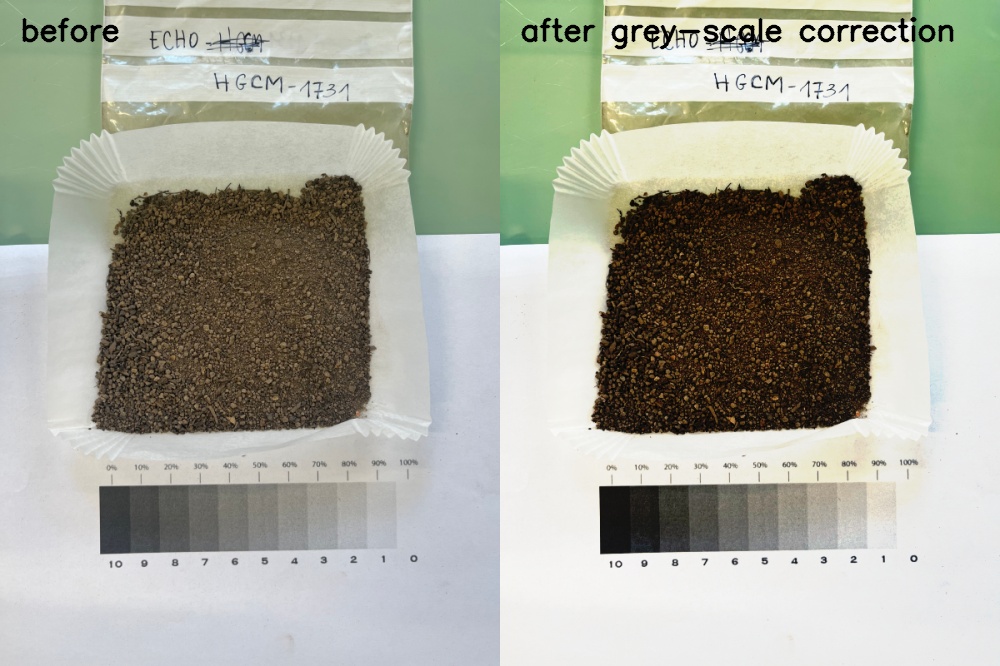
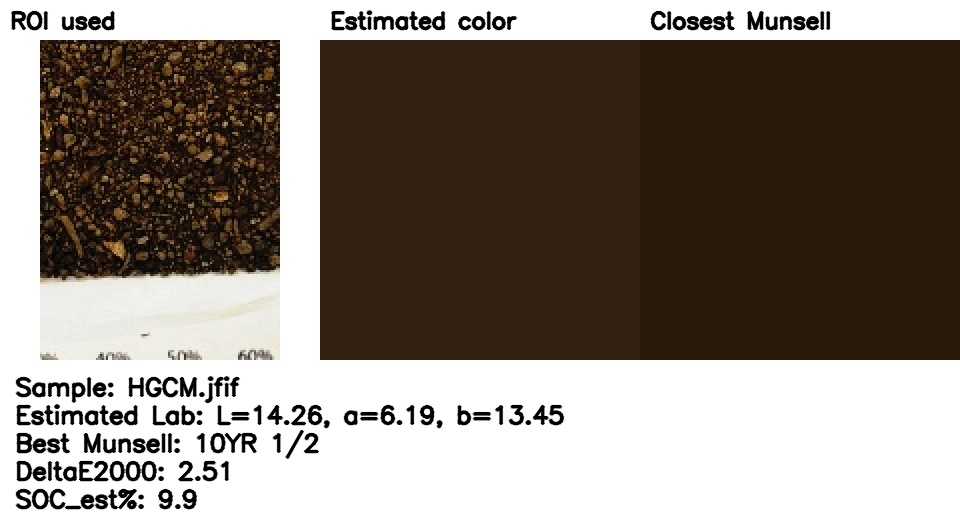
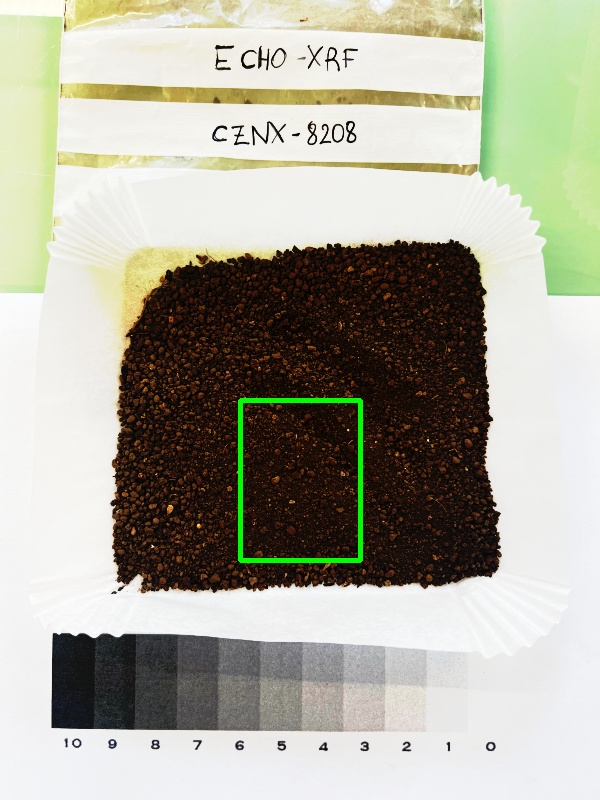
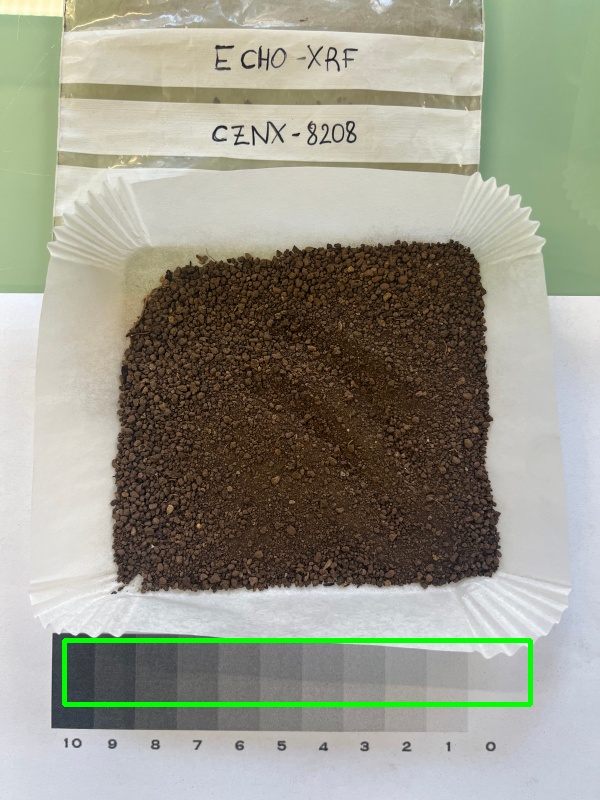
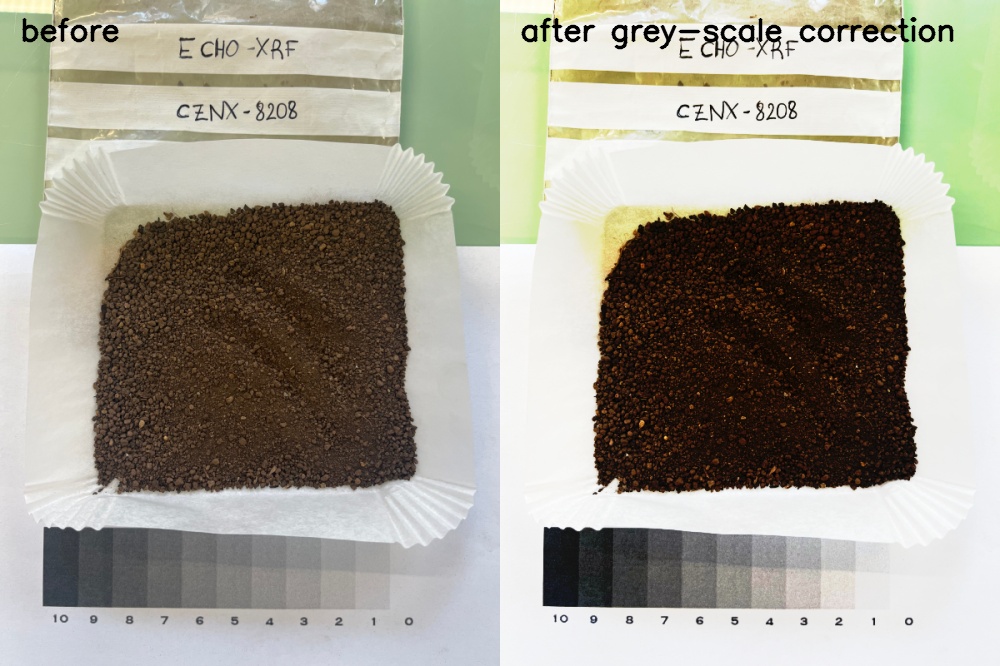
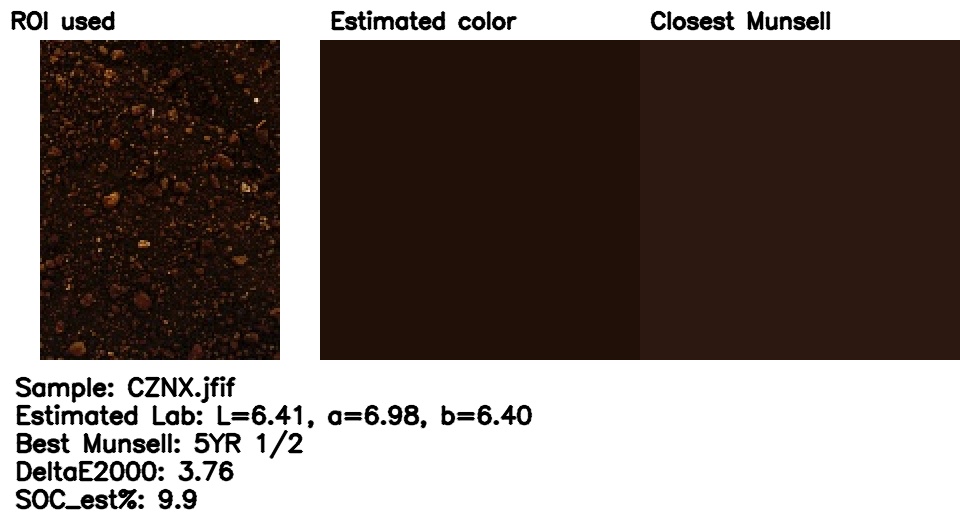
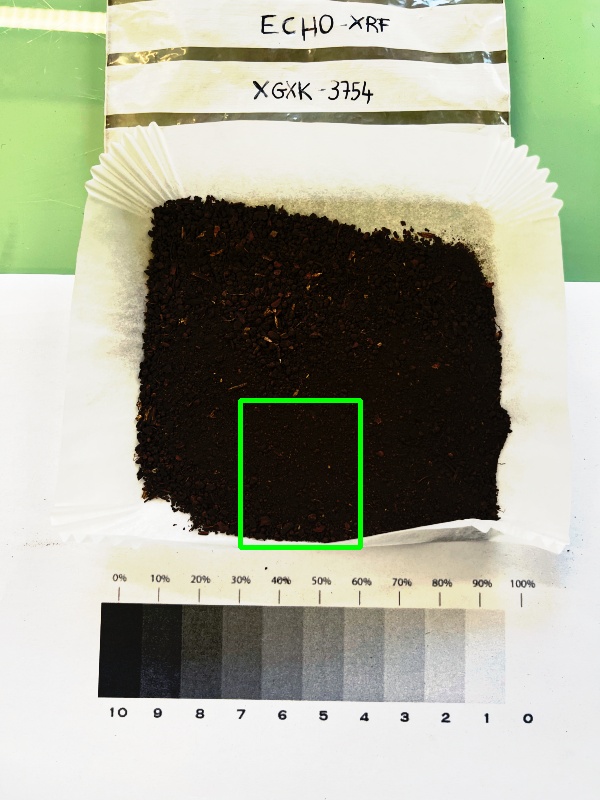
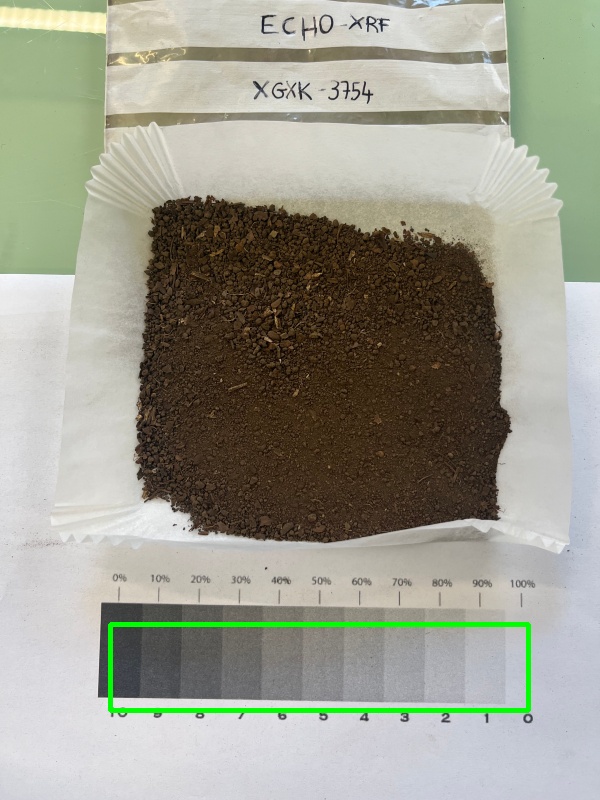
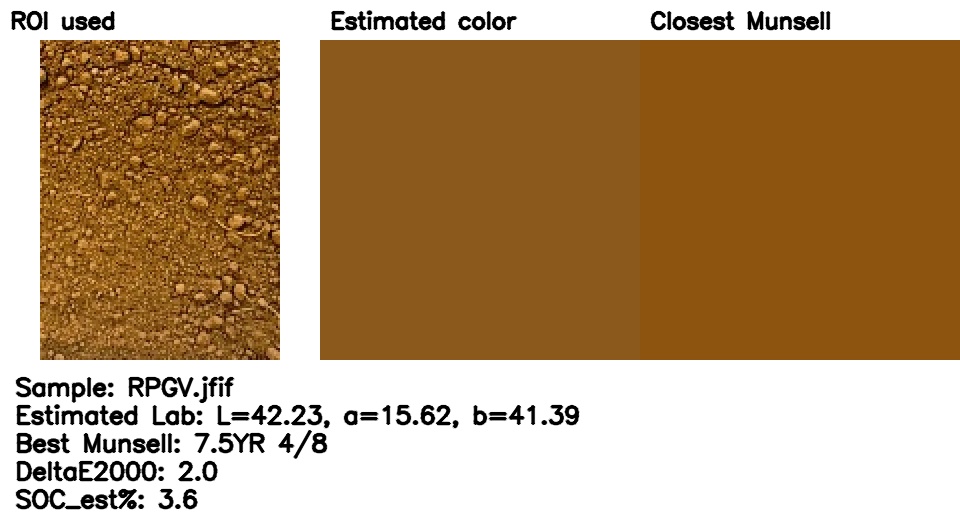
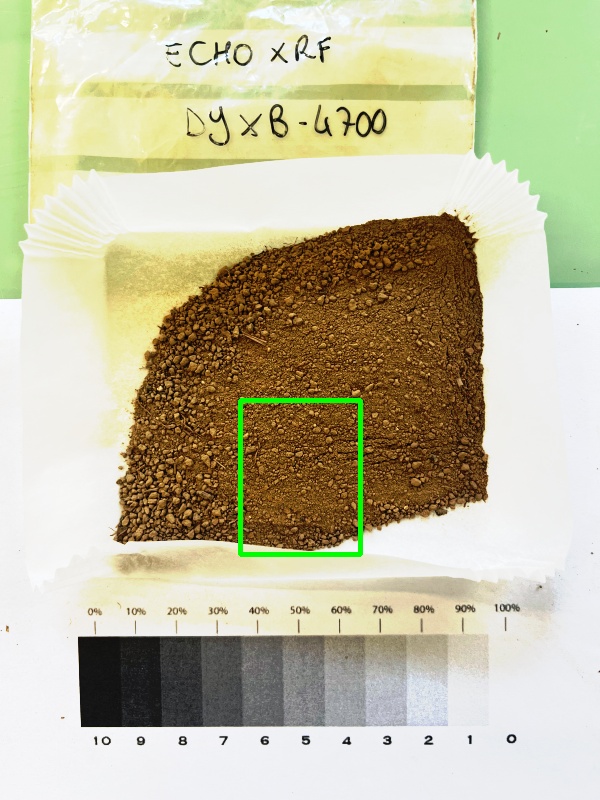
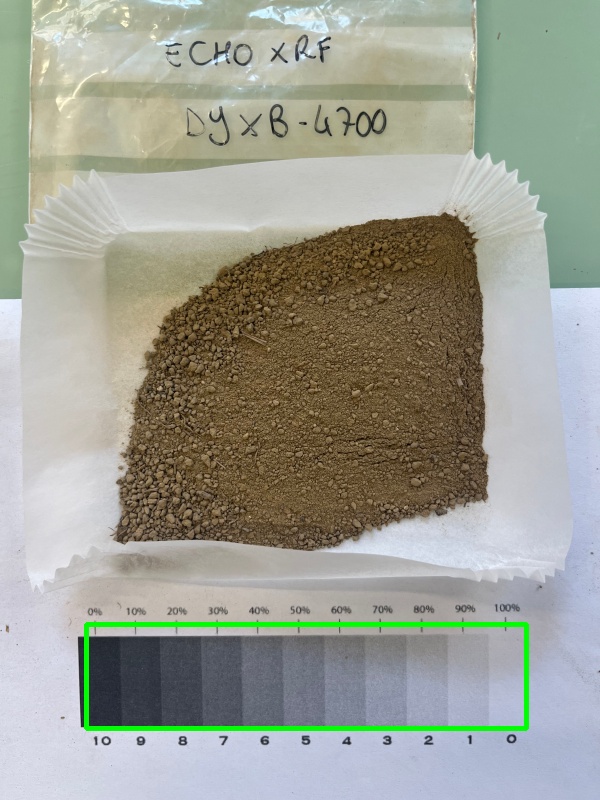
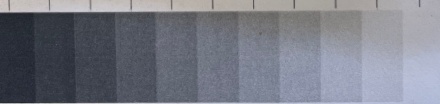
- Are grey-scale detection, correction, soil ROI, and colour outputs visually plausible?
run_model_experiment.py. This report does not retrain models and does not use final-test performance to select the winner.Grey-scale model experiment
The shared experiment contains 537 usable grey-scale samples: 486 development samples and 51 untouched final-test samples.
Models are selected by repeated five-fold cross-validation on development data. Final-test metrics are not used for selection.
The selected model improves held-out RMSE over the mean baseline by 1.295 orgC units.
The interpolated-Munsell model has 0.143 higher mean CV RMSE than the selected model.
All candidate models
| model | features | train_n | test_n | cv_RMSE_mean | cv_RMSE_sd | cv_MAE_mean | cv_MAE_sd | cv_R2_mean | test_RMSE | test_MAE | test_bias_pred_minus_lab | test_R2 | test_pearson_r |
|---|---|---|---|---|---|---|---|---|---|---|---|---|---|
| model_3_Lab_polynomial_ridge (selected by CV) | L + a + b | 486 | 51 | 3.474 | 1.045 | 1.932 | 0.277 | 0.291 | 2.215 | 1.677 | 0.199 | 0.601 | 0.778 |
| model_5_gradient_boosting | L + a + b + munsell_value_interp + munsell_chroma_interp + munsell_hue_sin + munsell_hue_cos + munsell_nearest_deltaE + munsell_weighted_deltaE + deltaE2000 | 486 | 51 | 3.587 | 1.011 | 1.920 | 0.296 | 0.221 | 2.278 | 1.599 | -0.162 | 0.578 | 0.764 |
| model_2_Lab | L + a + b | 486 | 51 | 3.597 | 1.081 | 2.093 | 0.269 | 0.239 | 2.462 | 1.904 | 0.227 | 0.508 | 0.716 |
| model_4_Munsell_interpolated | munsell_value_interp + munsell_chroma_interp + munsell_hue_sin + munsell_hue_cos + munsell_nearest_deltaE + munsell_weighted_deltaE | 486 | 51 | 3.618 | 1.142 | 2.024 | 0.290 | 0.247 | 2.808 | 2.064 | 0.141 | 0.360 | 0.621 |
| model_1_L | L | 486 | 51 | 3.658 | 1.057 | 2.142 | 0.259 | 0.206 | 2.394 | 1.890 | 0.259 | 0.535 | 0.741 |
| baseline_mean | L | 486 | 51 | 4.226 | 1.291 | 2.471 | 0.326 | -0.025 | 3.511 | 2.406 | 0.105 | -0.001 | -0.000 |
Metrics overview
| scenario | n | pearson_r | CCC_agreement | bias_mean_estimate_minus_lab | MAE | RMSE | R2_direct_prediction | bland_altman_lower_95 | bland_altman_upper_95 |
|---|---|---|---|---|---|---|---|---|---|
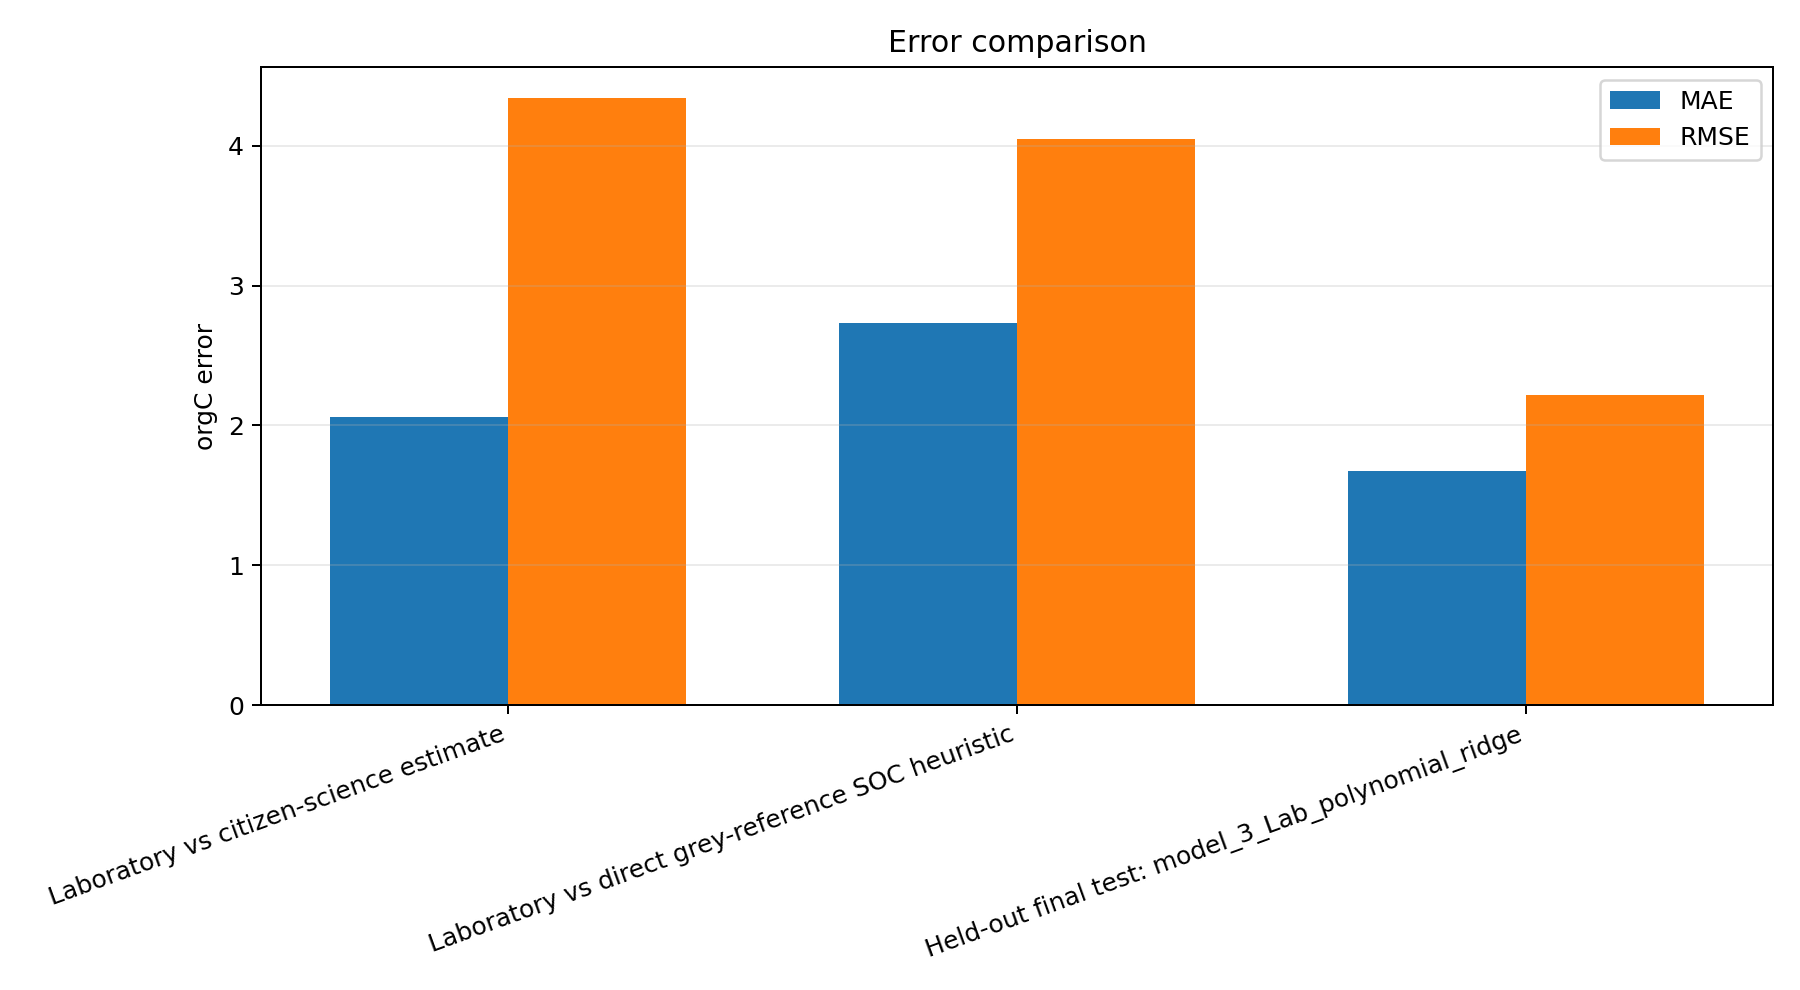
| Laboratory vs citizen-science estimate | 531 | 0.289 | 0.100 | -1.094 | 2.060 | 4.344 | 0.011 | -9.342 | 7.154 |
| Laboratory vs direct grey-reference SOC heuristic | 455 | 0.545 | 0.362 | 1.452 | 2.731 | 4.050 | 0.178 | -5.966 | 8.870 |
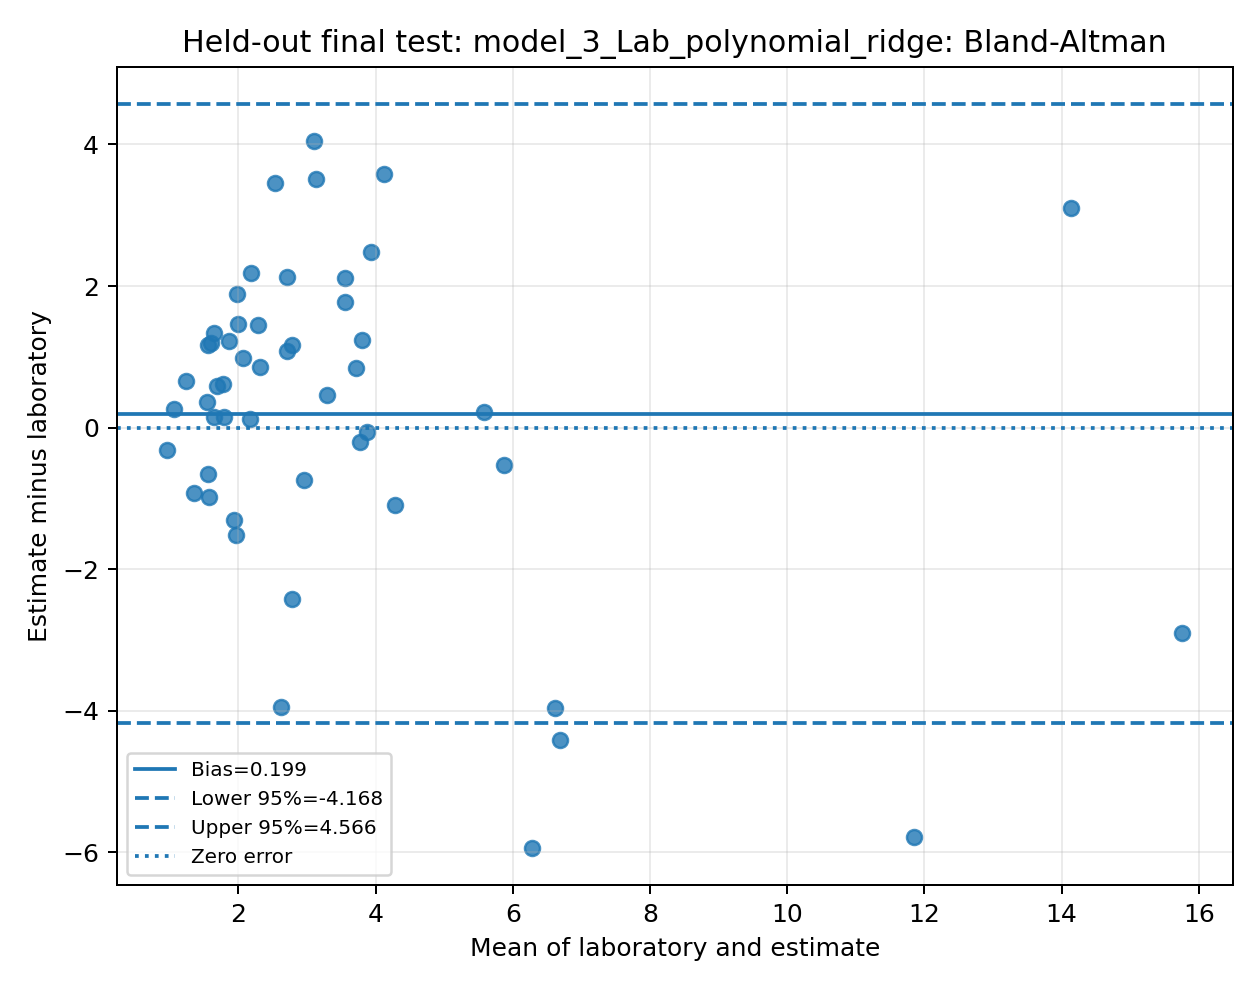
| Held-out final test: model_3_Lab_polynomial_ridge | 51 | 0.778 | 0.758 | 0.199 | 1.677 | 2.215 | 0.601 | -4.168 | 4.566 |
Error comparison
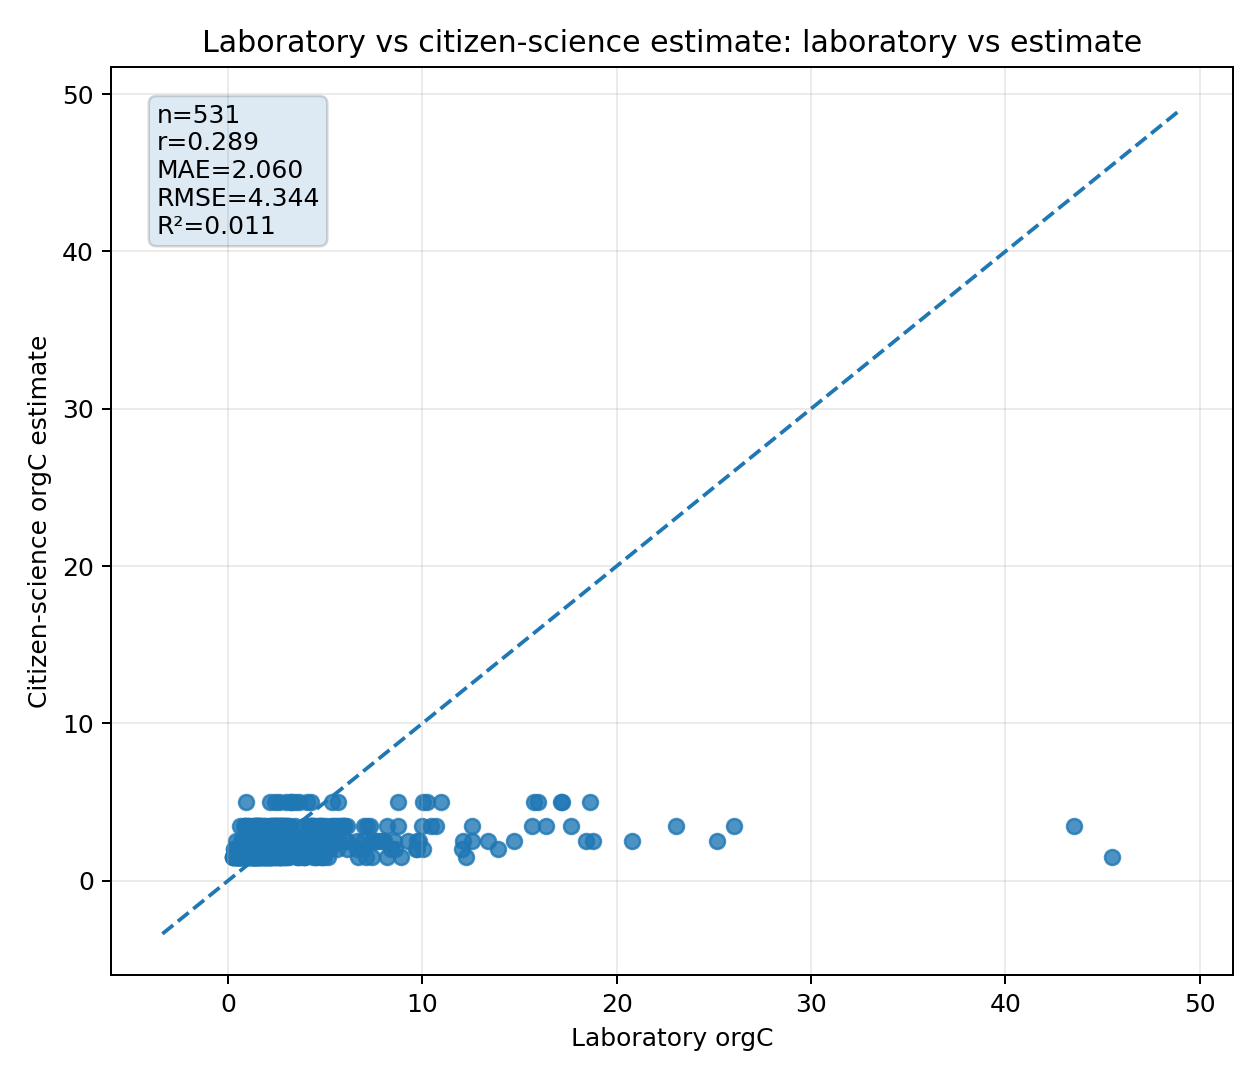
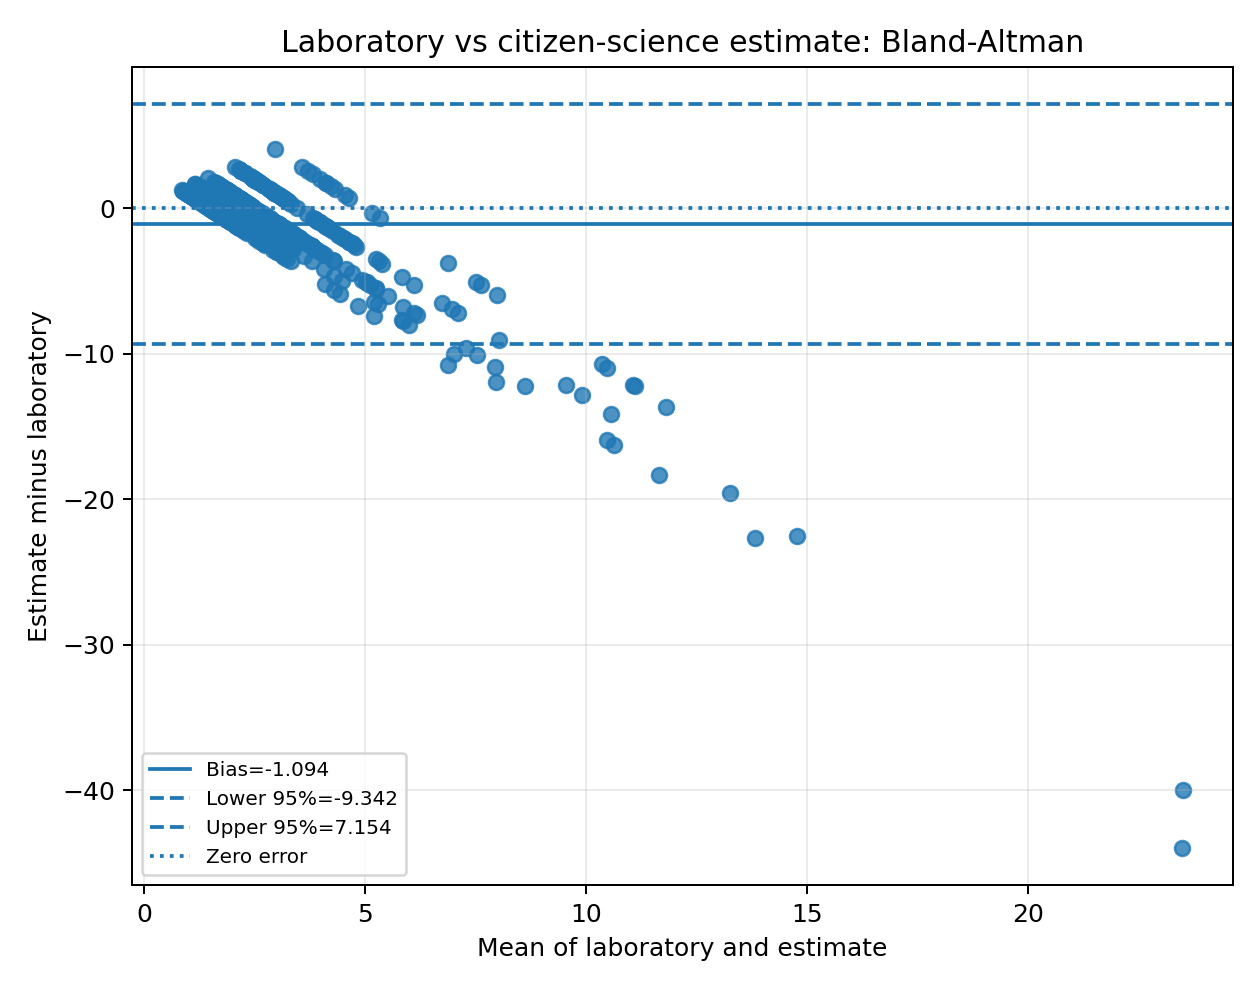
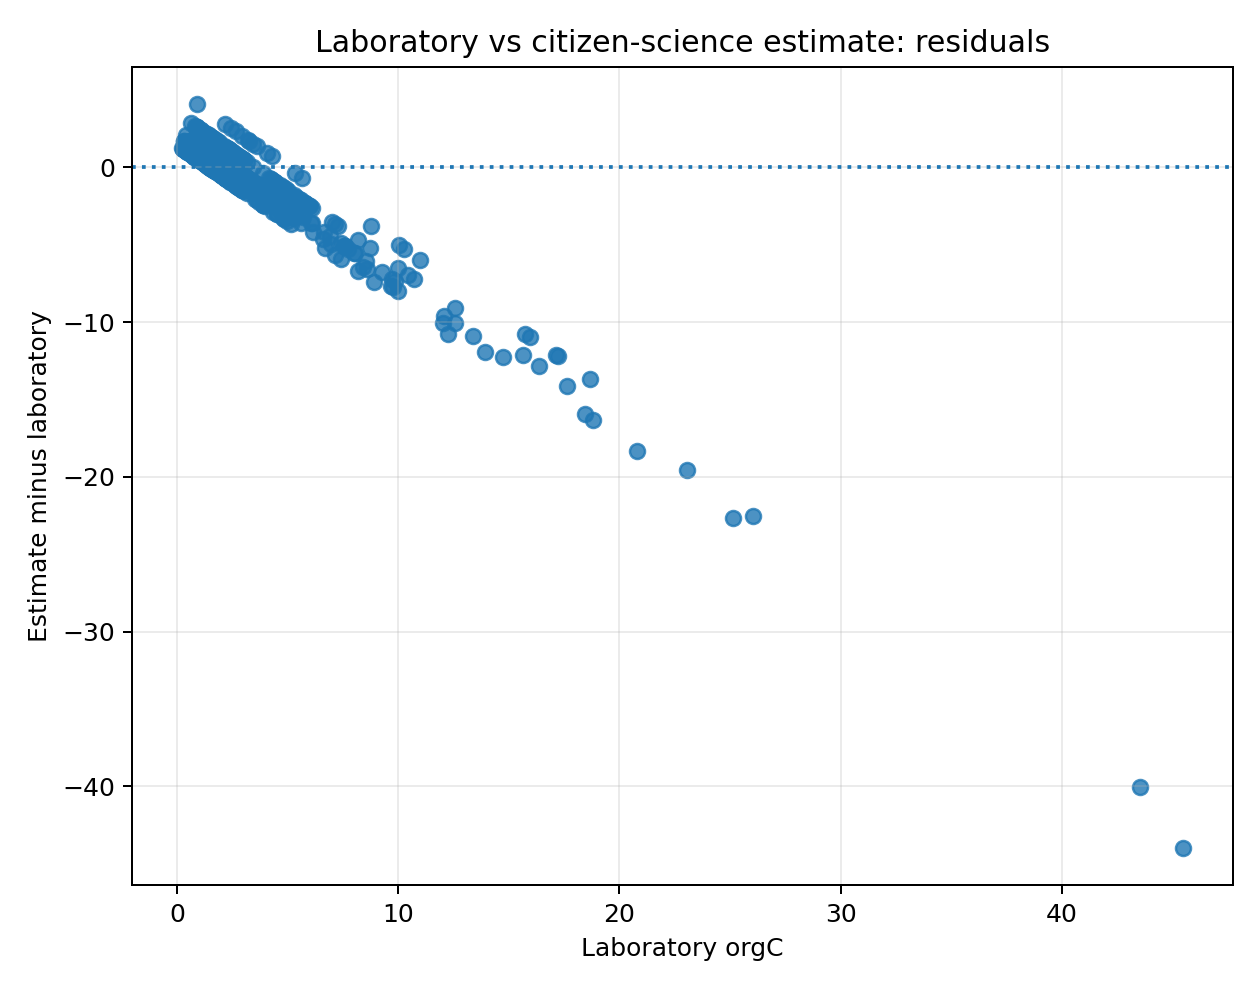
Laboratory vs citizen-science estimate
External baseline only; it is not used to train or select image models.
Commentary
- This comparison contains n = 531 samples.
- The linear association is weak: Pearson r = 0.289.
- The method underestimates laboratory orgC by 1.094 units on average.
- Prediction error is MAE = 2.060 and RMSE = 4.344.
- R² is low (0.011); this is not yet a validated quantitative estimator.
- Citizen estimates are an external baseline and do not participate in image-model selection.
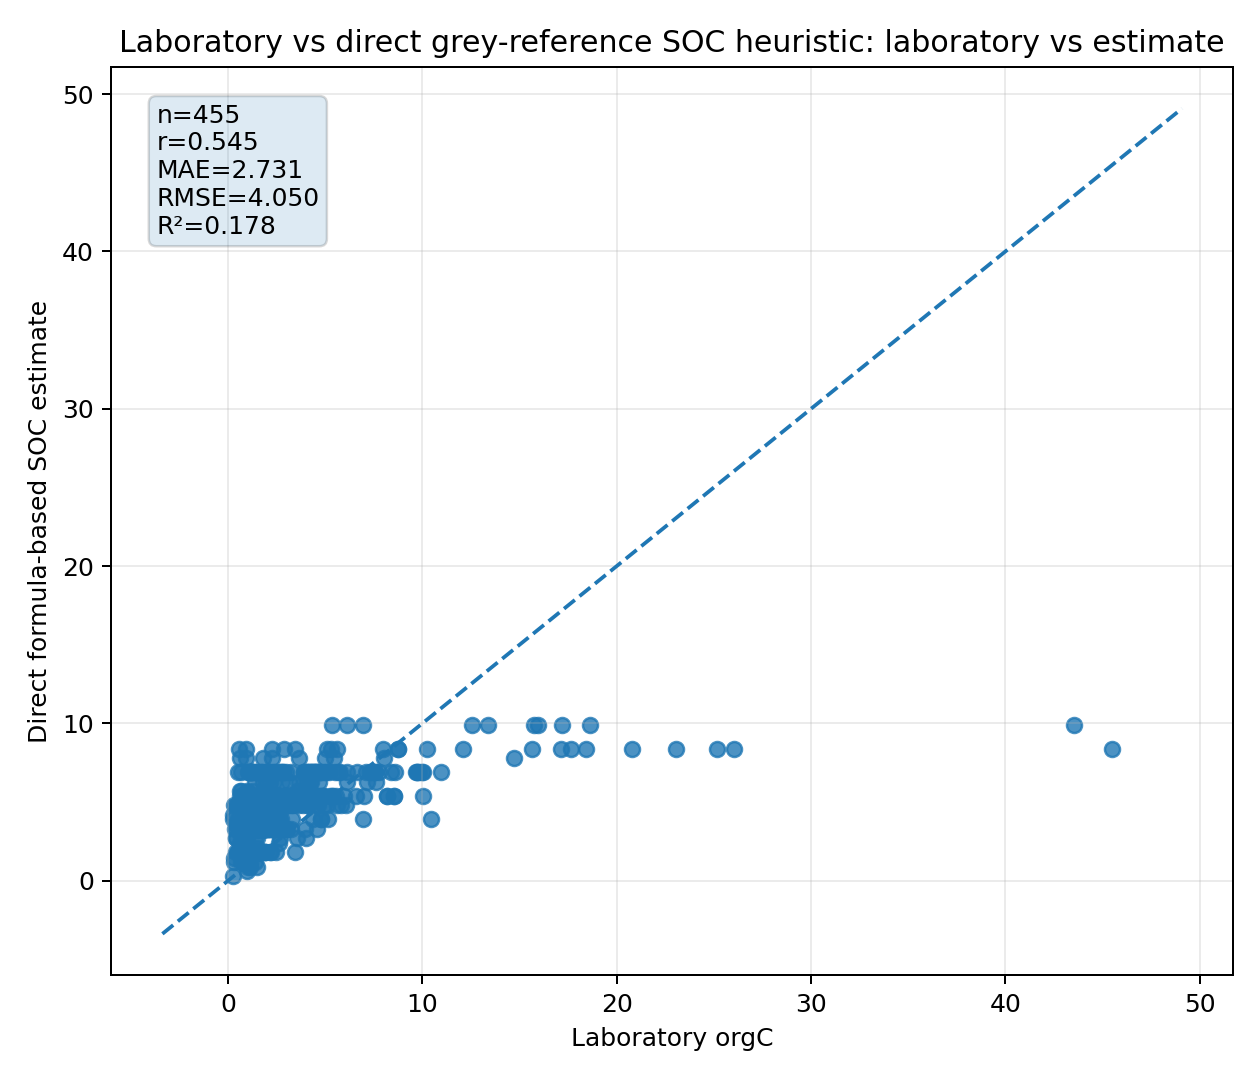
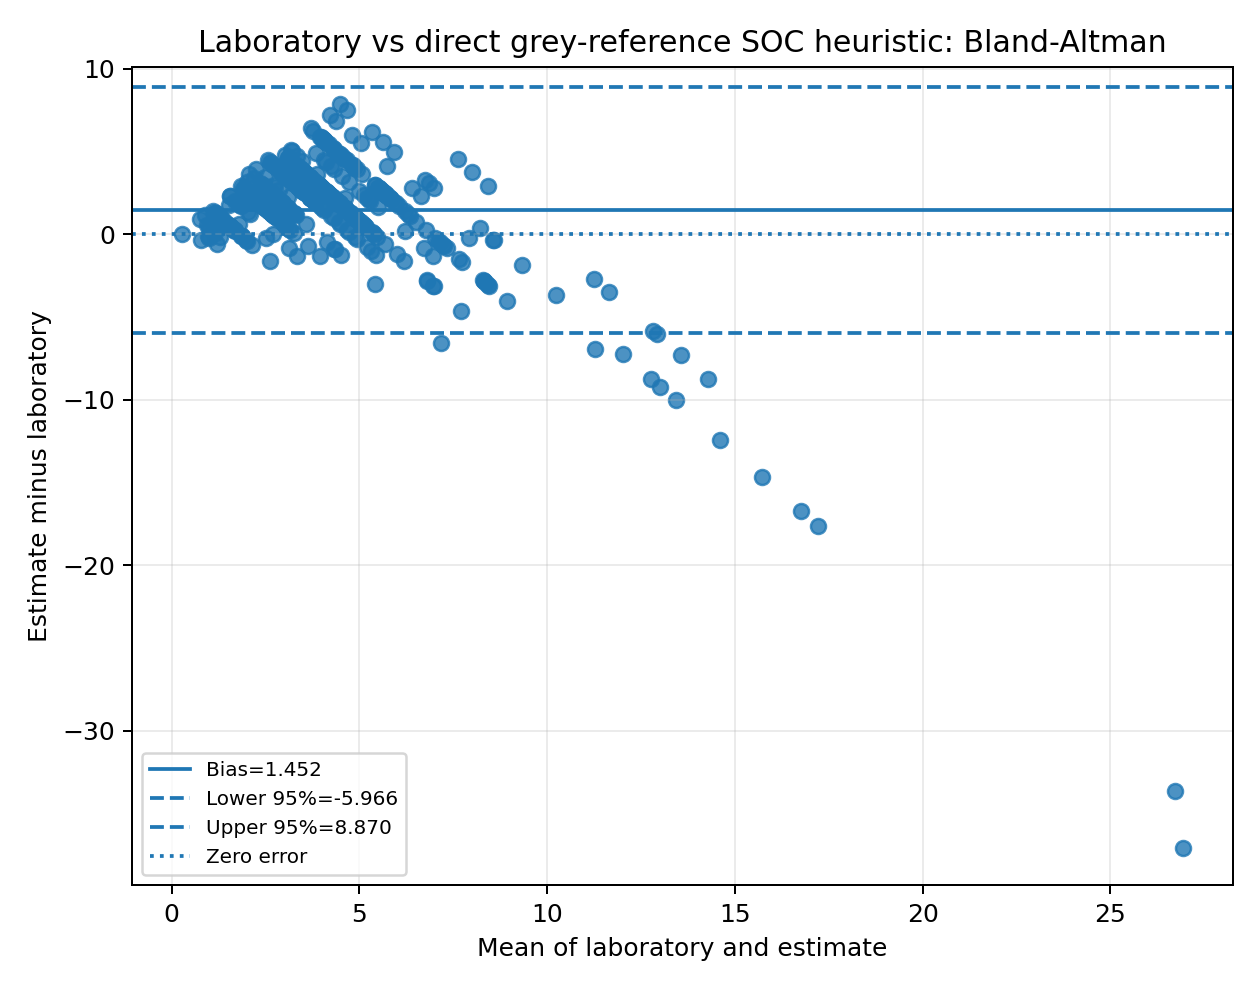
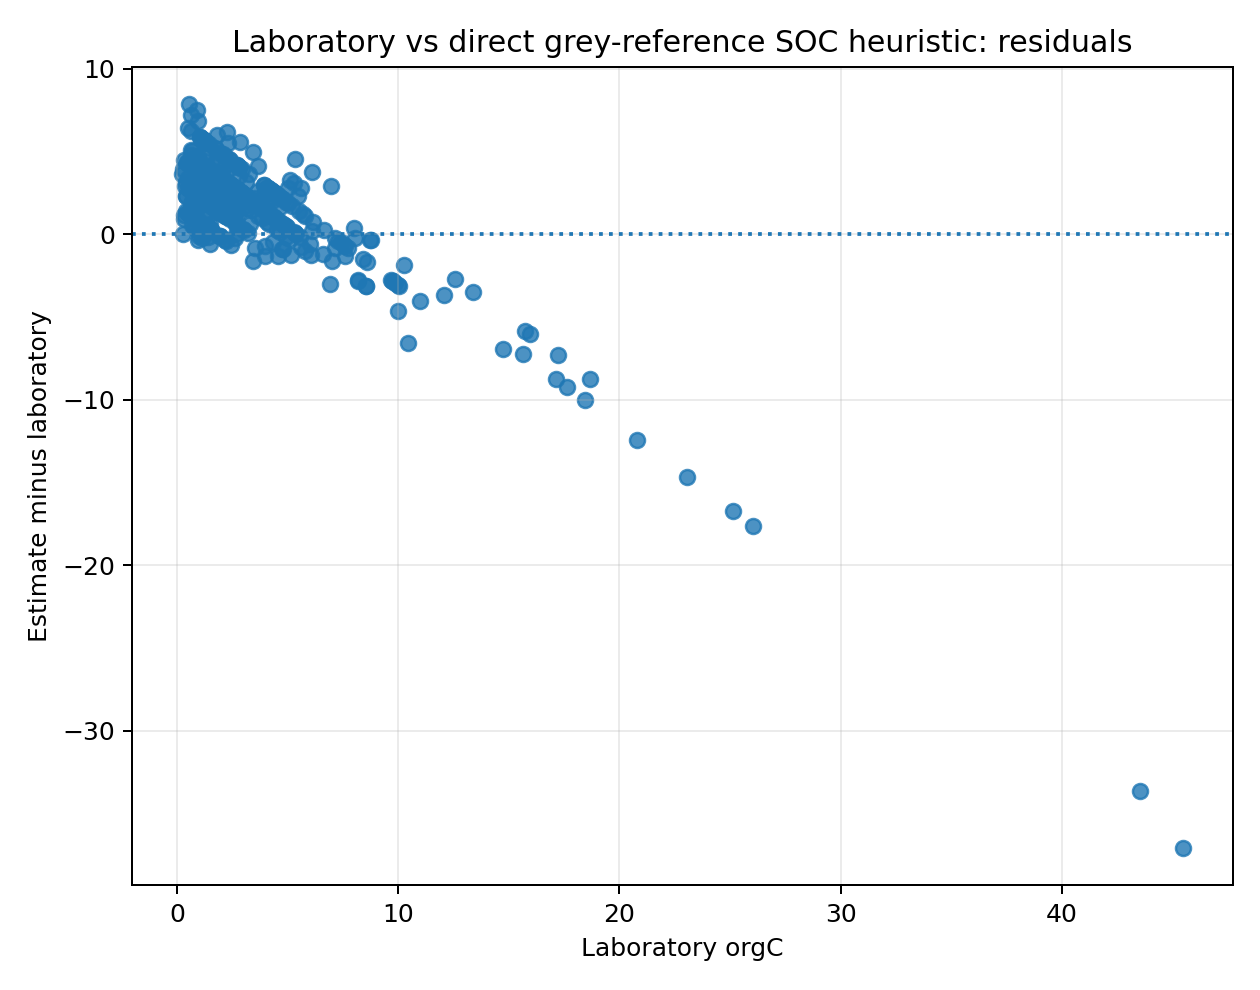
Laboratory vs direct grey-reference SOC heuristic
Formula-based estimate for photographs acquired in the grey-reference mode; no supervised training is involved.
Commentary
- This comparison contains n = 455 samples.
- The linear association is moderate: Pearson r = 0.545.
- The method overestimates laboratory orgC by 1.452 units on average.
- Prediction error is MAE = 2.731 and RMSE = 4.050.
- R² is low (0.178); this is not yet a validated quantitative estimator.
- This is a direct formula-based SOC estimate, not a trained prediction model.
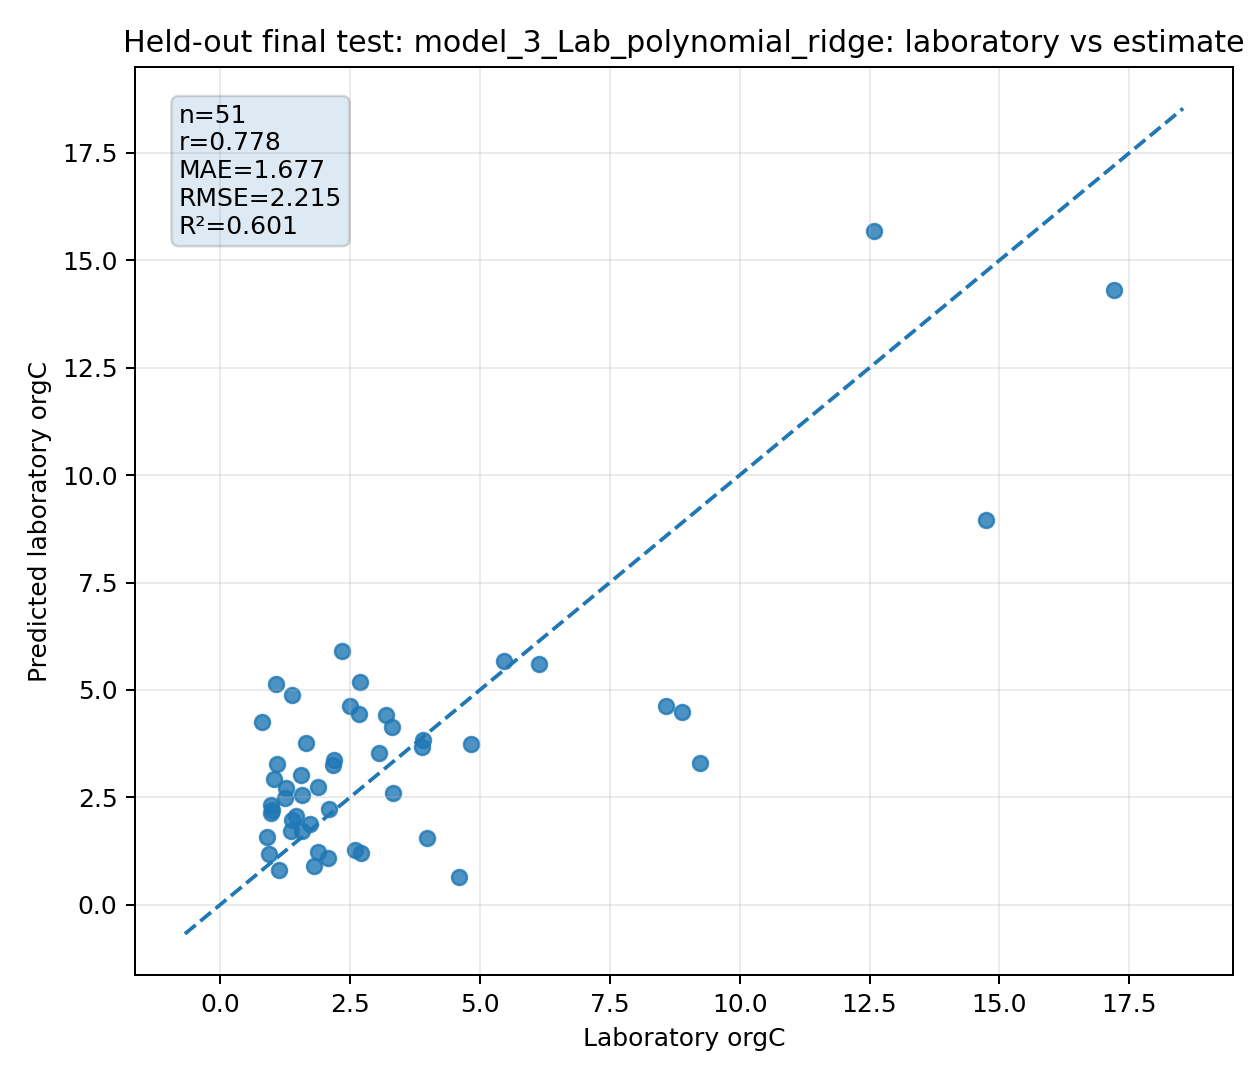
Held-out final test: model_3_Lab_polynomial_ridge
Selected solely by the lowest repeated-CV RMSE among non-baseline models; test metrics were not used for selection.
Commentary
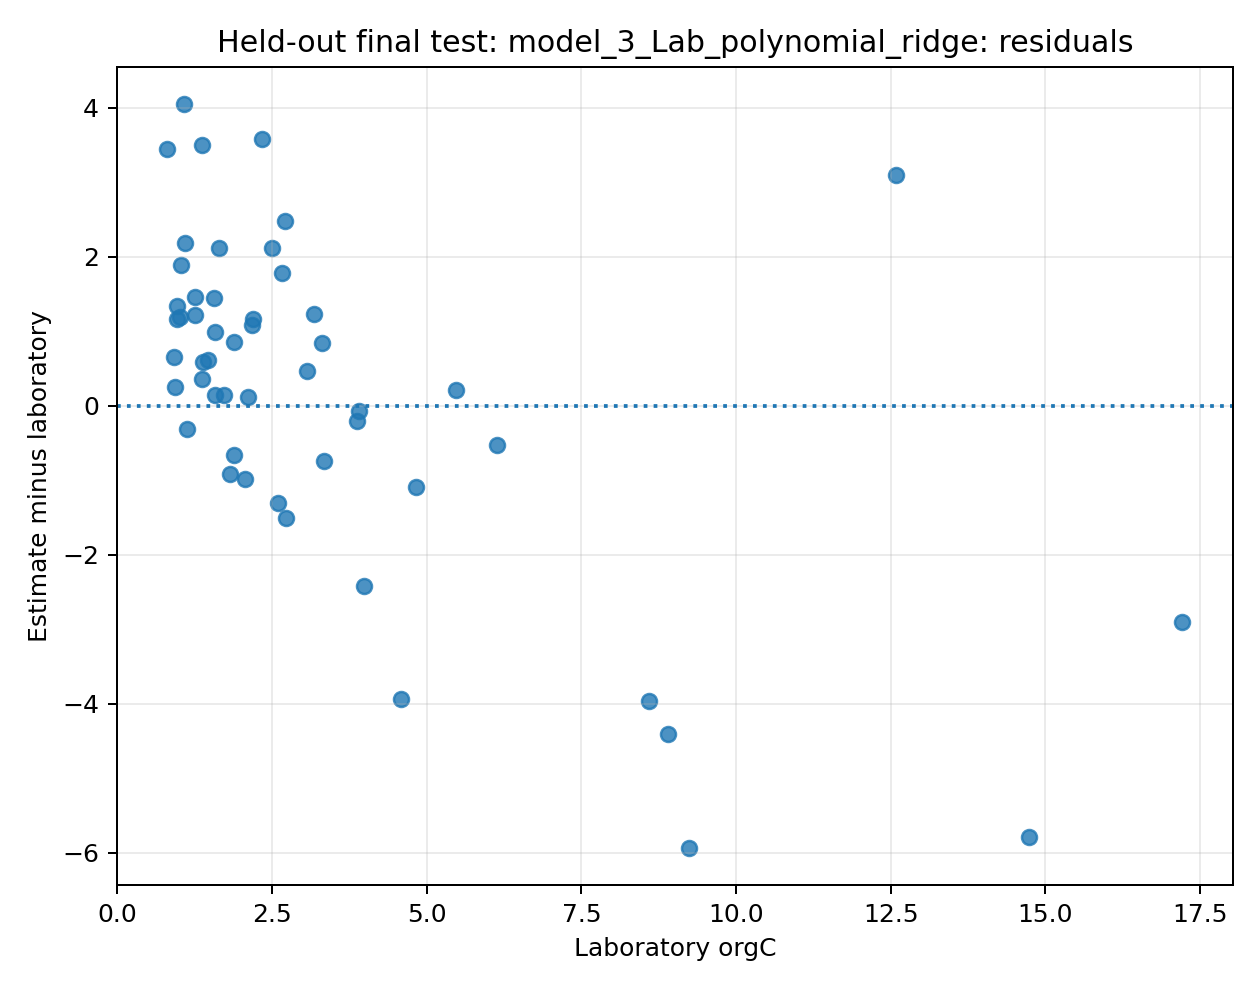
- This comparison contains n = 51 samples.
- The linear association is strong: Pearson r = 0.778.
- The method overestimates laboratory orgC by 0.199 units on average.
- Prediction error is MAE = 1.677 and RMSE = 2.215.
- R² is relatively strong (0.601), although further independent validation remains appropriate.
- Model 'model_3_Lab_polynomial_ridge' was selected by repeated cross-validation on development data. The values shown here come from the untouched final test set.
Largest final-test errors
These cases should be prioritised for image-QC review and investigation of non-colour soil factors.
| SampleCode | ID | image | lab_value | predicted_value | residual | absolute_error |
|---|---|---|---|---|---|---|
| DWZD | DWZD-2970 | DWZD.jfif | 9.245 | 3.308 | -5.937 | 5.937 |
| NZNP | NZNP-4793 | NZNP.JPG | 14.739 | 8.952 | -5.787 | 5.787 |
| DFEG | DFEG-5724 | DFEG.jfif | 8.895 | 4.487 | -4.408 | 4.408 |
| DCZZ | DCZZ-2268 | DCZZ.jfif | 1.083 | 5.132 | 4.049 | 4.049 |
| FXTB | FXTB-5745 | FXTB.jpg | 8.589 | 4.628 | -3.961 | 3.961 |
| WTMW | WTMW-8913 | WTMW.jpg | 4.588 | 0.647 | -3.941 | 3.941 |
| PBGU | PBGU-5744 | PBGU.jpg | 2.339 | 5.917 | 3.578 | 3.578 |
| CFFS | CFFS-8444 | CFFS.jpg | 1.373 | 4.881 | 3.508 | 3.508 |
| NGUR | NGUR-1817 | NGUR.jpg | 0.806 | 4.258 | 3.452 | 3.452 |
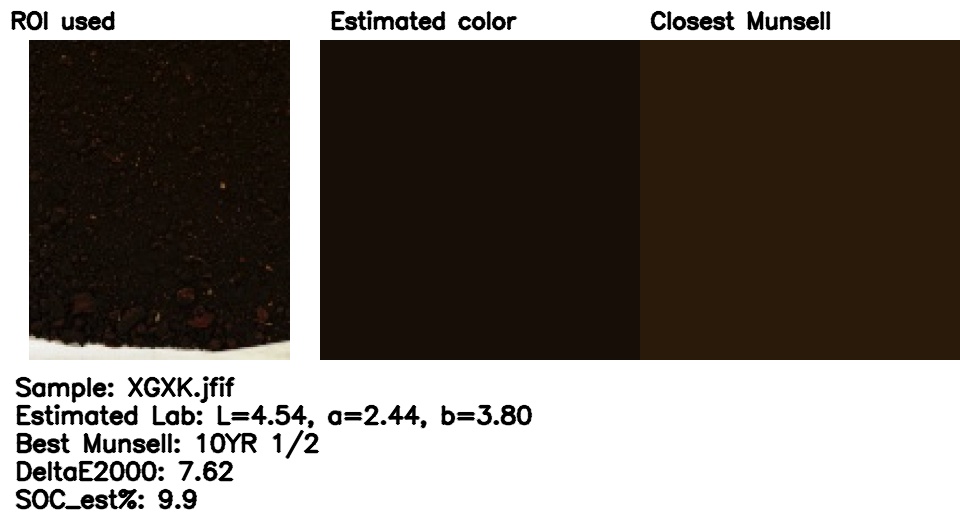
| XGXK | XGXK-3754 | XGXK.jfif | 12.579 | 15.681 | 3.102 | 3.102 |
How to interpret MAE and RMSE
MAE is average absolute error; RMSE penalises large errors more strongly. Lower is better. Comparisons are most meaningful on the same sample set.
| scenario | MAE | RMSE | RMSE_MAE_ratio | interpretation |
|---|---|---|---|---|
| Laboratory vs citizen-science estimate | 2.060 | 4.344 | 2.108 | Large errors are influential. |
| Laboratory vs direct grey-reference SOC heuristic | 2.731 | 4.050 | 1.483 | Some larger errors are present. |
| Held-out final test: model_3_Lab_polynomial_ridge | 1.677 | 2.215 | 1.321 | Some larger errors are present. |
Image-processing quality control
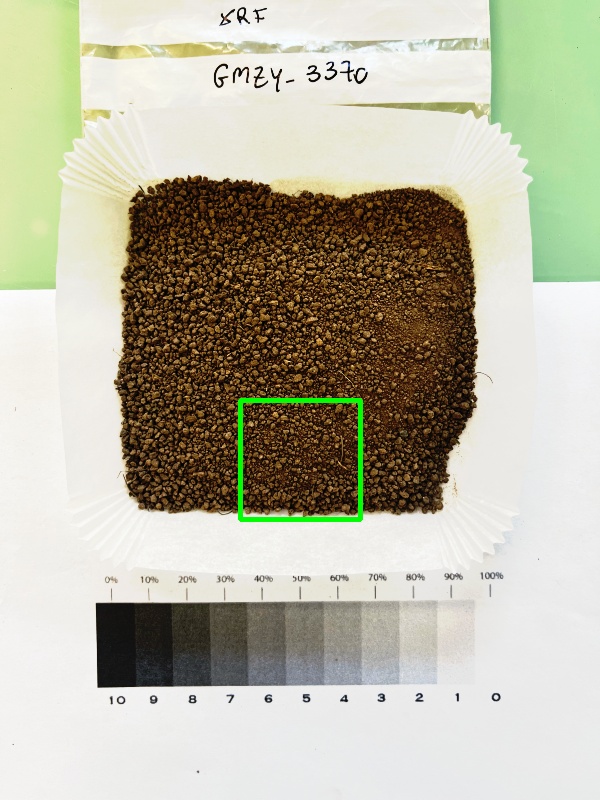
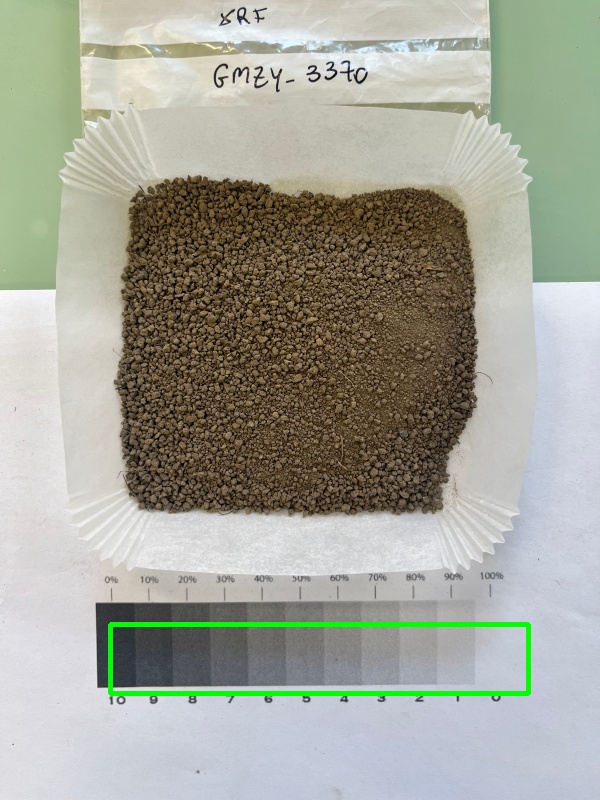
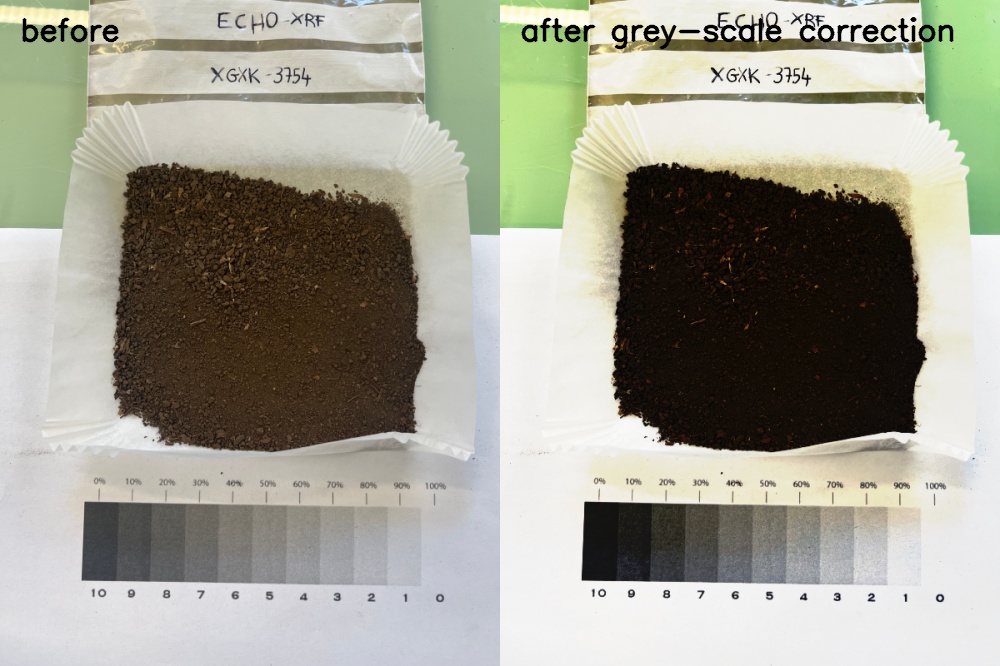
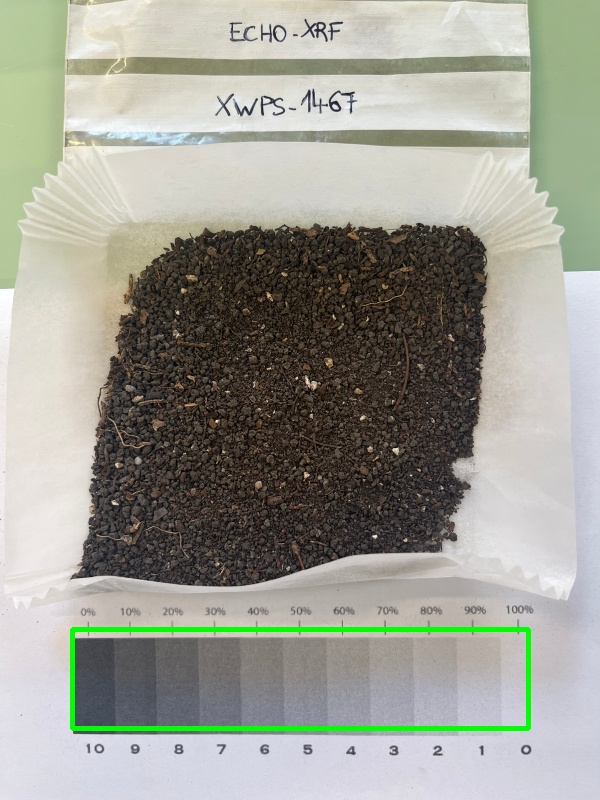
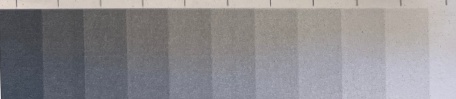
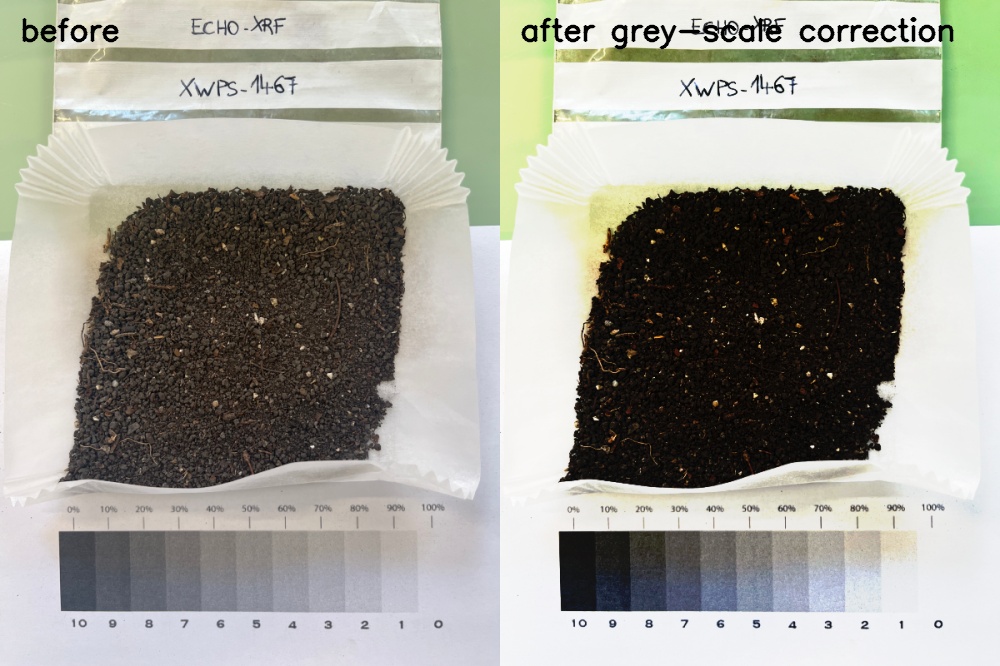
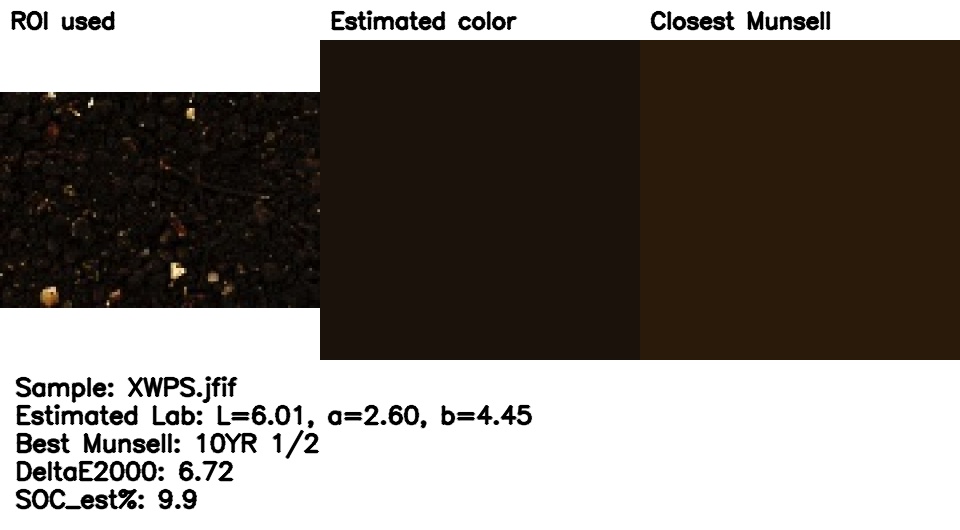
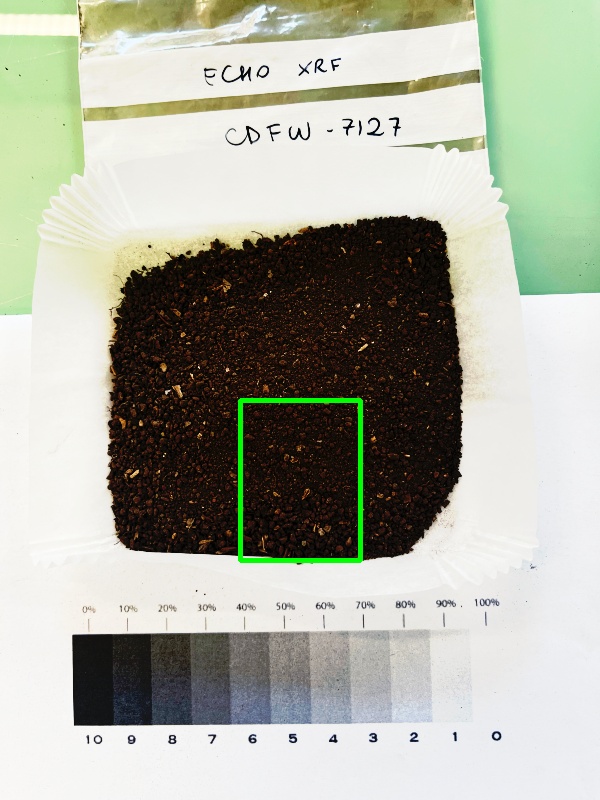
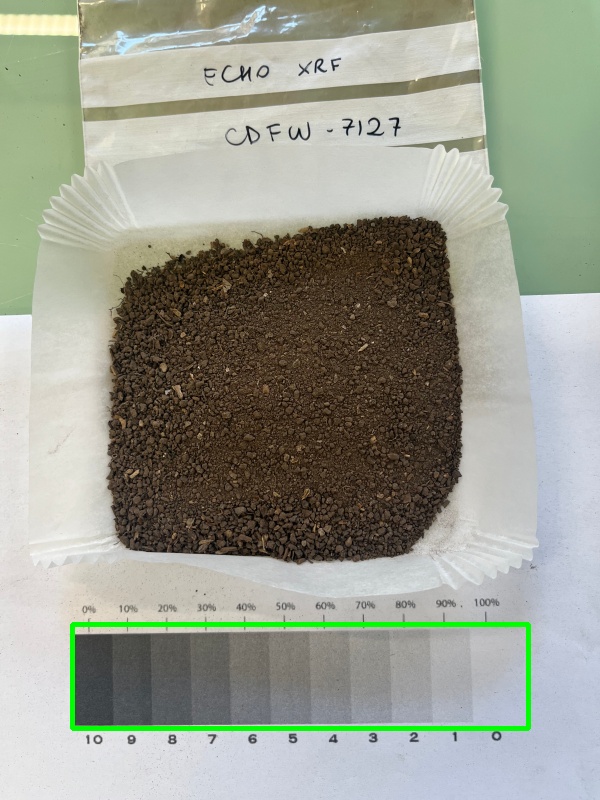
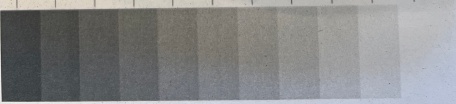
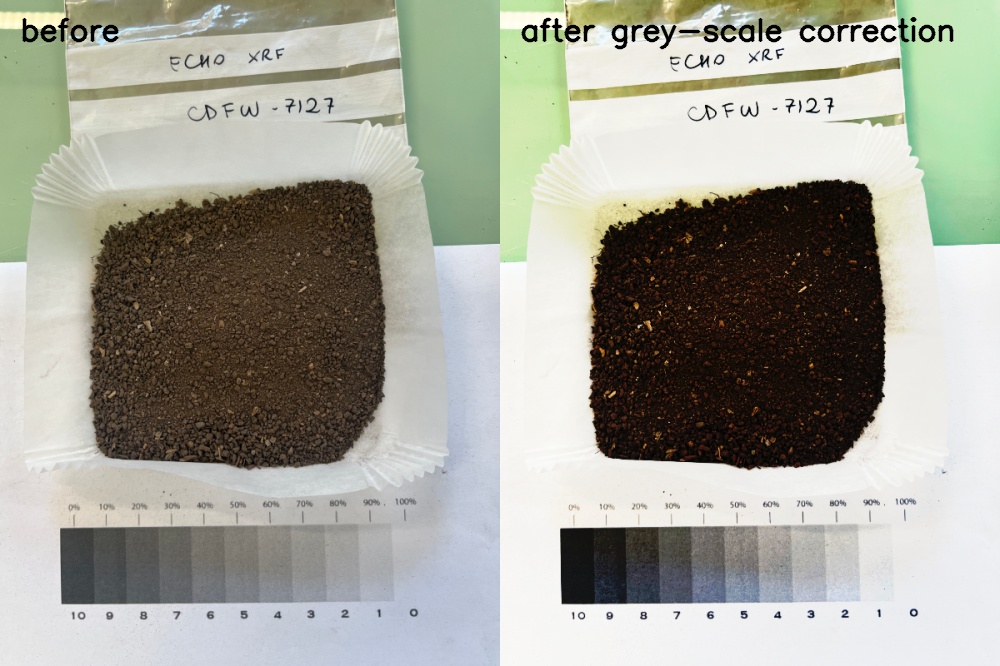
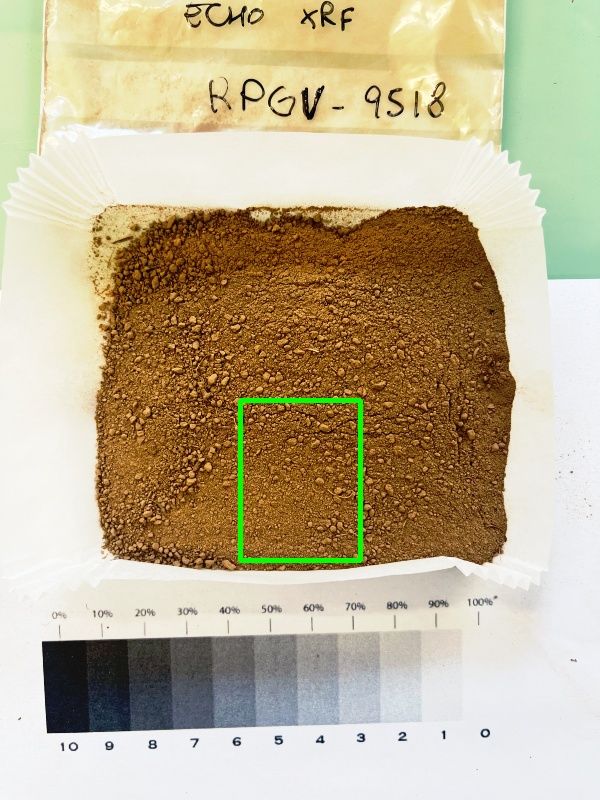
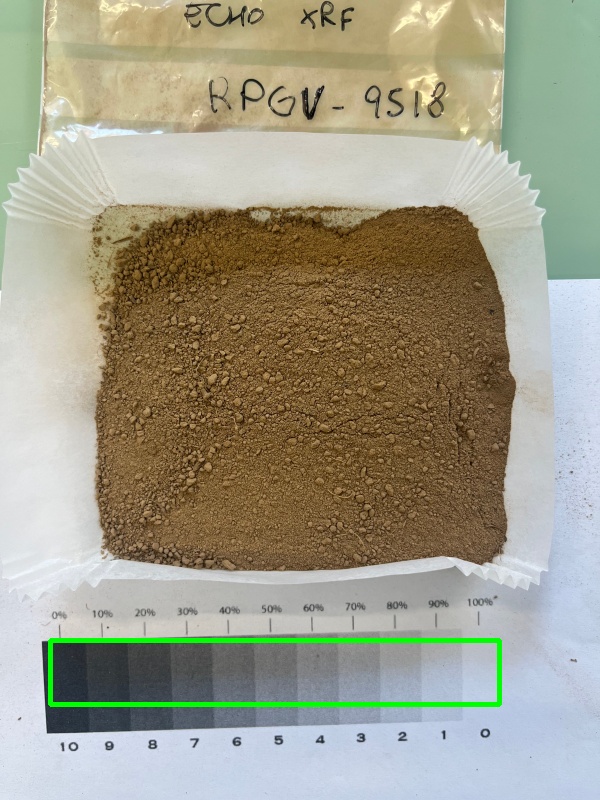
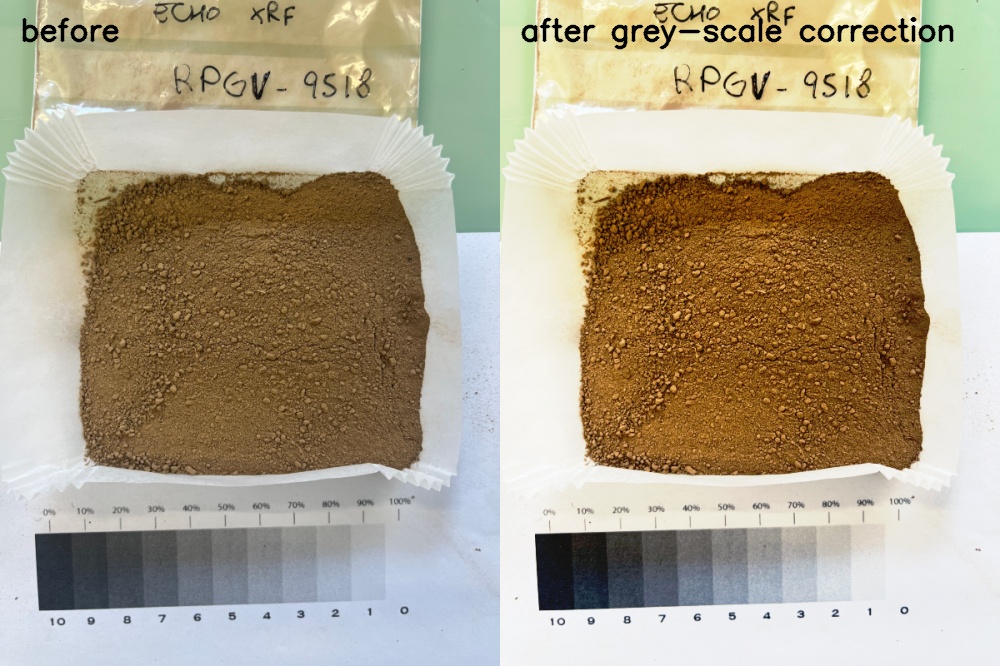
Automatically selected examples are restricted to grey-reference photographs and prioritise samples with complete diagnostic artefacts.
Sample GMZY
QC assets: 5/5 expected QC artefacts available

Sample HGCM
QC assets: 5/5 expected QC artefacts available

Sample CZNX
QC assets: 5/5 expected QC artefacts available

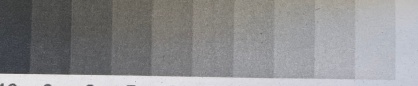
Sample XGXK
QC assets: 5/5 expected QC artefacts available
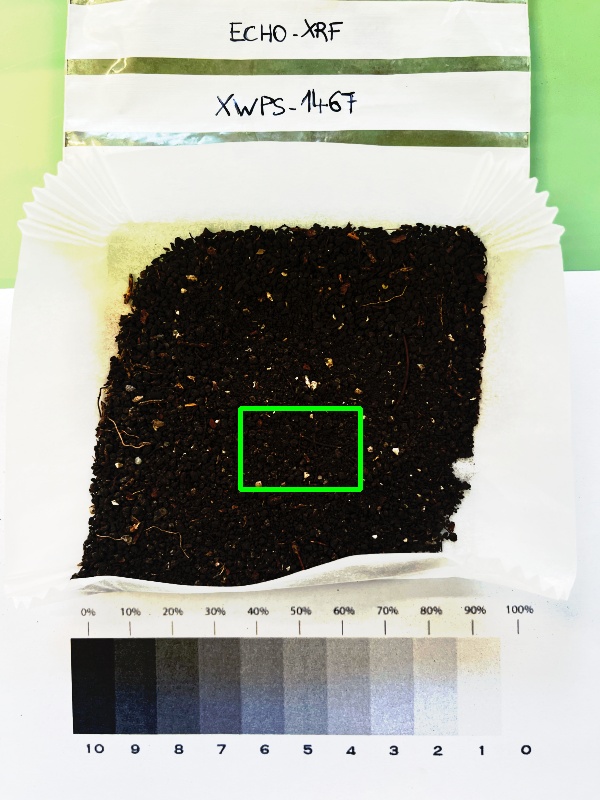
Sample XWPS
QC assets: 5/5 expected QC artefacts available
Sample CDFW
QC assets: 5/5 expected QC artefacts available
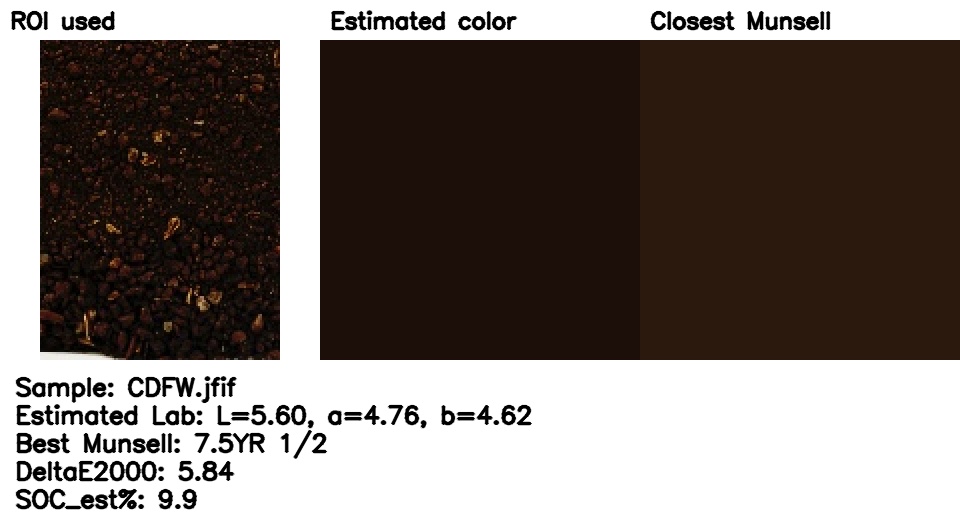
Sample RPGV
QC assets: 5/5 expected QC artefacts available

Sample DYXB
QC assets: 5/5 expected QC artefacts available
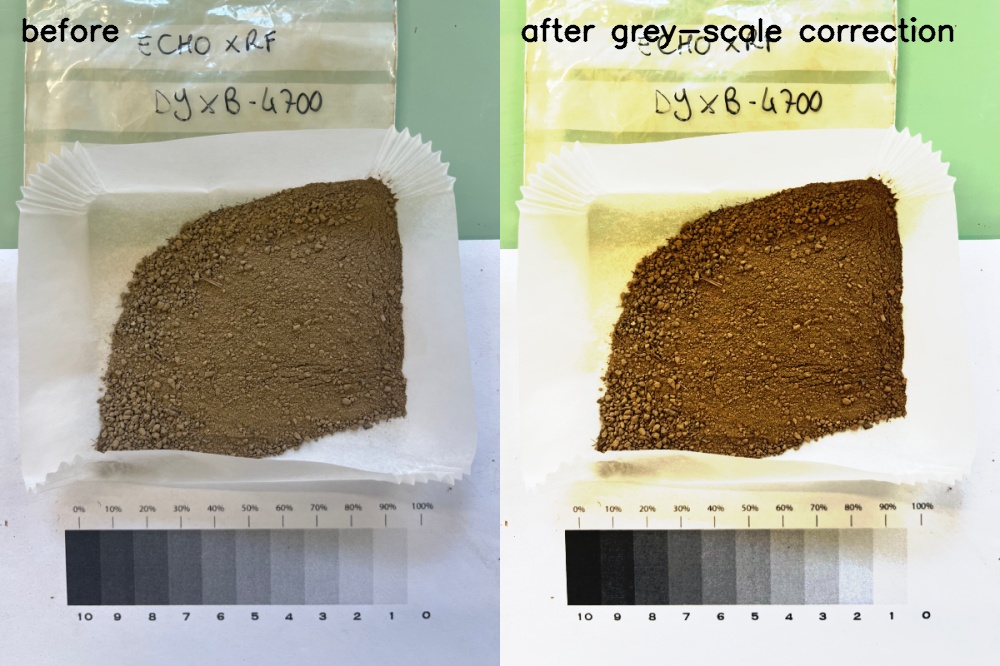
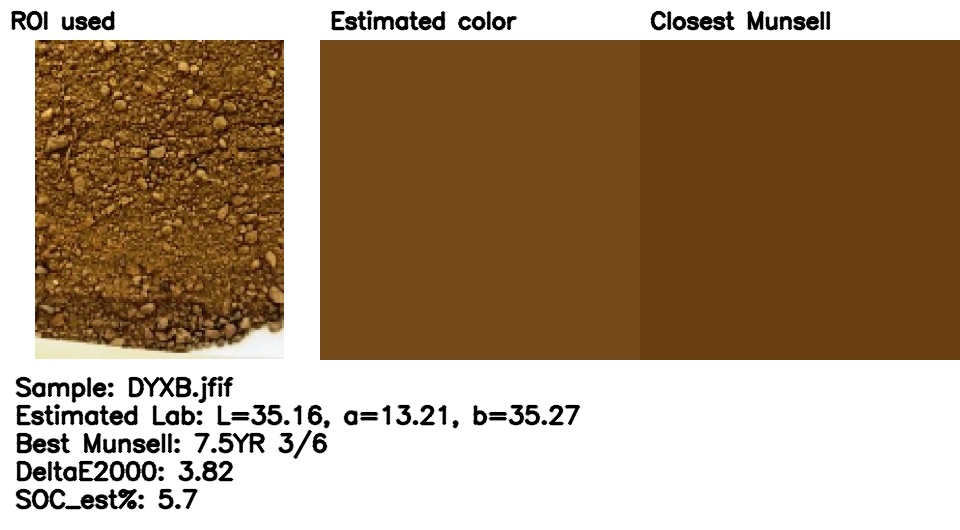
How to present the current status
- The primary statistical result is the selected grey-scale model's performance on the untouched final test set.
- Repeated cross-validation is used for model selection; final-test metrics are used only for final evaluation.
- The direct SOC formula and citizen-science estimate are baselines, not inputs to model selection.
- Interpolated Munsell features add predictive value only if their CV performance improves on continuous Lab features.
- Visual QC remains necessary because an incorrect grey-scale crop or soil ROI can invalidate numerical results.